Google Apps and Google Apps For Education (GAFE) are a powerful set of online apps that can be used on any device and platform to enhance teacher and student eLearning opportunities.
Schools should use the table below to check whether their situation is better suited to a Google Apps for Education account or a private Google Apps account and then create and ratify an Online Services/Cloud Solutions Consent Form before students start using either online service.
Schools should use the table below to check whether their situation is better suited to a Google Apps for Education account or a private Google Apps account and then create and ratify an Online Services/Cloud Solutions Consent Form before students start using either online service.
|
Google Apps (Public)
|
Google Apps For Education (GAFE)
|
Google App Management Solutions
To make the management of Google Apps for Education easier to teachers can schools there is Google Classroom (launched in September 2014) and a number of other 3rd party management solutions. Read below to learn more:
Google Classroom
After successful private beta testing in early 2014, in September 2014, Google launched Google Classroom for schools who have a Google Apps for Education account.
Google Classroom is an administration tool for teachers, who can use a central dashboard to create, embed, distribute, communicate, collect, monitor, grade and give feedback on student work utilising Google Apps such as Drive, Docs and Gmail. Watch the videos below to learn more.
Google Classroom is an administration tool for teachers, who can use a central dashboard to create, embed, distribute, communicate, collect, monitor, grade and give feedback on student work utilising Google Apps such as Drive, Docs and Gmail. Watch the videos below to learn more.
Using Google Classroom is easy!
If your school does not use Google Apps for Education, your administrator can sign up here.
- If your school has a Google Apps for Education account, visit classroom.google.com and sign in.
- Select whether you are a teacher or a student, then create or join a class.
If your school does not use Google Apps for Education, your administrator can sign up here.
3rd Party Google Apps Administration Tools
There are a number of different third-party providers of solutions to help schools manage student usage of Google Apps/Google Apps for Education. Check out the following video about Hapara Tools for Google Apps that makes using Google Apps more manageable.
The Google Apps
There are a myriad of free Google Apps for users to choose from that provide the workspace and opportunity for people to work simultaneously and collaboratively on documents, spreadsheets, slides (e.g. Google Docs, Sheets and Slides), as well as also manage and maintain websites and wikis (Google Sites), blogs (Blogger), YouTube videos and Picasa images. With Google Drive, users can have their own online storage (15GB) to collect and collate student work in one common place that can then be accessed form anywhere in the world with an internet connection.
Contained below are just a few examples of how Google Apps can be used in educational settings:
Contained below are just a few examples of how Google Apps can be used in educational settings:
Google Forms
Google Forms are generally being used by educators in two methods:
1. Google Forms for Assessment
The use of Google Forms that shows the most potential for transforming education is the use of Google Forms to capture assessment and reporting data. Educators are creating private Google Forms that can be used:
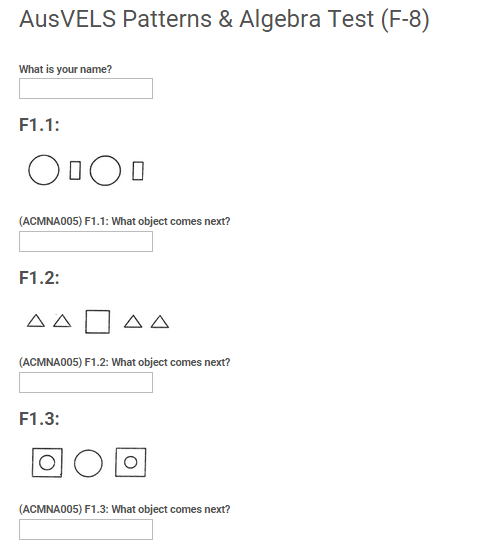
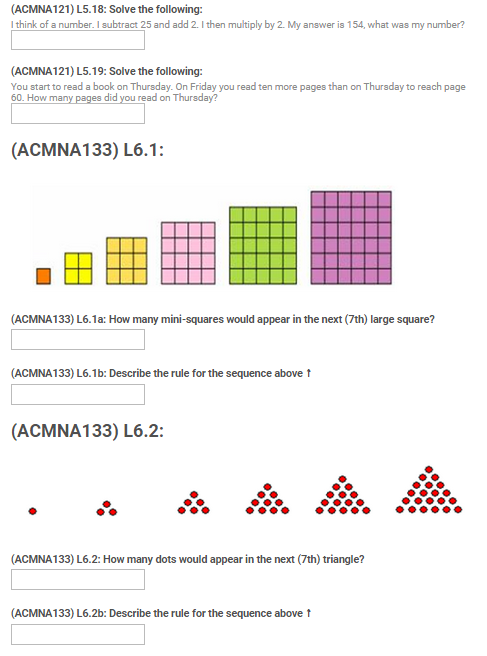
Seen below is one example of an online test created using Google Forms to test student knowledge of the standards and content descriptors of AusVELS Mathematics: Patterns & Algebra, from Foundation to end of Year 8. Use this quicklink or click on/select the images below to access the student copy of the online test (however you will not be able to see the results).
- as pre- or post-tests to assess student understanding (which can then be automatically corrected by using a third-party app such as Flubaroo)
- daily in class (e.g. via accessing the Google Form on an iPad/laptop) to record their ongoing notes of student progress during small group and one-to-one learning scenarios and whilst correcting student work.
Seen below is one example of an online test created using Google Forms to test student knowledge of the standards and content descriptors of AusVELS Mathematics: Patterns & Algebra, from Foundation to end of Year 8. Use this quicklink or click on/select the images below to access the student copy of the online test (however you will not be able to see the results).
|
|
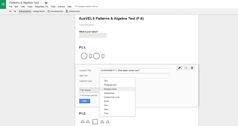
Educators simply need to set up a Google Form with multiple combo boxes (e.g. one containing all student names and another with all subject names) and create the relevant fields for capturing data (e.g. Date, Comment, Progress). The data captured from a Google Form is automatically collated in a central file, which can be accessed at a later date.
The portability and accessibility of the Google Form and central data file allows teachers to access their assessment and reporting notes from anywhere, at anytime. For teachers working in time-sharing scenarios, Google Forms allows multiple users to access and edit the the data simultaneously. The data can also be filtered by student name to show parents during parent-teacher meetings.
To learn more:
- Access a case study presented at the Australian Council for Educational Research Excellence in Professional Practice Conference 2015 explaining how staff and students at St Marks (Dingley, Victoria, Australia) use Google Forms to deliver teacher designed online assessments to drive differentiated instruction in mathematics
- Staff from Catholic schools in Victoria, Australia can access a video showing the use of Google Docs being used by teachers for assessment and reporting practices through CEVN here.
2. Google Forms for Surveys
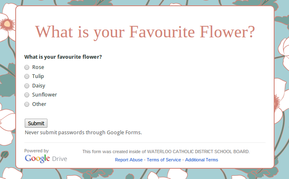
Google Forms can be used by students and teachers to create online forms that serve as polls to gather data from others within the school and with permission, those outside of school.
Such uses can be great to quickly create and distribute (e.g. via email) surveys/polls and then collate and analyse the collected data. Watch the video below to learn more:
Such uses can be great to quickly create and distribute (e.g. via email) surveys/polls and then collate and analyse the collected data. Watch the video below to learn more:
Google Drive
With the prevalence of free online storage solutions, schools and students should be making the move away using USBs to enables the same files to be accessible between the classroom and the home. By using online solutions, staff and students can easily access and interact with files no matter where they are (with no more excuses that they lost their files or usb).
Whilst there are numerous free online storage solutions, each with various handy in-built apps and storage capacities, Google Drive takes the cake.

Drive for Education is due to be released soon and will provide GAFE users with:
- Unlimited storage: with support for individual files up to 5TB in size
- Vault: Search and discovery for compliance needs
- Enhanced Auditing: Reporting and auditing tools and an Audit API easily let you see the activity of a file.

Google Drive provides users with 15GB of free online storage via a Google Account with
- A 10GB file size limit
- Each account linked to YouTube, Google+, Google Search, Google Play, Google Maps, Google Mail, Google Calendar and Google News
- A downloadable Google Drive application for Windows or Mac to sync files from a specified folder
- A Google Drive app is available from the App Store for iPhone and iPad and Google Play for Android devices
- Videos that can be hyperlinked to for school blogs/websites/projects (but not be embedded/streamed via html).
Schools are also using Google Drive to shift their student digital portfolios online, making them accessible to a wider audience.
At the sending of a link and the click of a button, family and friends all around the world can access student made portfolio multi-modal content including eBooks, film, digital tutorials, podcasts, and online content (such as blogs and Google docs).
However, before schools make the shift to online, they must consider:
Click here to access a comprehensive guide on how schools can embrace using Google Drive to unlock the potential of their student interactive ePortfolios (and to also access a complete student interactive ePortfolio).
At the sending of a link and the click of a button, family and friends all around the world can access student made portfolio multi-modal content including eBooks, film, digital tutorials, podcasts, and online content (such as blogs and Google docs).
However, before schools make the shift to online, they must consider:
- Redrafting policies, including Internet and Media Publishing Consent and Waiver Forms (click to download a sample), as most school Media Release Consent Forms do not address the move towards cloud-based storage and the sharing of digital content with a local/national/global audience)
- Gauging parental support before making any student work and images potentially accessible by the general public (download a ready-made Interactive ePortfolio Parent Information and Permission Form)
- The approach: online storage vs online presentation.
Click here to access a comprehensive guide on how schools can embrace using Google Drive to unlock the potential of their student interactive ePortfolios (and to also access a complete student interactive ePortfolio).
Google Docs/Slides/Sheets/Sites
Google Docs, Sheets & Slides provides schools with the opportunity to set up collaborative work situations where all students can access the same document, presentation or spreadsheet simultaneously and collate their work, whilst also giving students the opportunity to see 'live' how other classmates are recording and presenting their findings.
Unlike the other text-based online meeting services reviewed here, students can save their rich ongoing communication via chatting in a Google Doc or a designated column in Sheets. Their communications will be automatically saved and can be used as evidence in the communication and collaboration process (which teachers can also access if they are added to the list of authorised viewers/moderators).
Learn more about the potential for online collaboration and presentation via the following case study of two schools and their science experiment, 'Rotten Tomatoes : Observing the decomposition of fruit and vegetables'.

The Rotten Tomatoes Logo is a trademark or registered trademark of Flixster, Inc. in the United States and other countries.
Fourth Grade teachers from the Connect Charter School (formally Calgary Science School), created a post on their school blog about their Rotten Tomatoes Decomposition Lab (Blog Site 1 | Blog Site 2), a scientific experiment that required students to use a collaborative Google Sheet to record the scientific data collected on the decomposition of tomatoes.
They also created a website dedicated to the experiment (using Google Sites) where the teachers uploaded the details of the experiment, the class created and uploaded a rubric for the experiment, and then students uploaded videos of their final lab reports. After the experiment had finished, students continued to write posts in their student blog about their scientific observations.
After discovering their blog in the middle of a semester long science inquiry/integrated topic, I drew inspiration from their idea and ran a similar experiment with Year 4-6 students to observe the decomposition of fruit and vegetables.
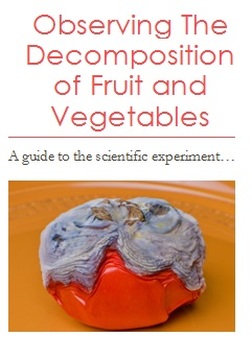
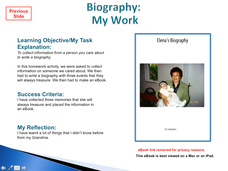
The experiment was introduced to the students in the form of an information flyer (printed in colour A4 - which they then took home) which was also uploaded to the class blog (for those parents who subscribed to the blog) as a downloadable eBrochure (click here or on the image to the left to download it). Thus the two avenues ensured that various lines of communication were open to ensure that parents could learn about the focus of the Science and Mathematics classes for the following weeks.
The experiment was modified from that of the rotten tomatoes experiment, to give students the chance to choose any fruit or vegetable, which as the introductory activity, instantly lead to a flurry of excited discussions and the selection of a wide variety of choices made, from bananas and tomatoes to cucumbers and onions (the onions were great!).
Similar to the rotten tomatoes experiment, students were grouped into threes (a mix of students of different ages was required) to complete the required roles (on a daily rotational basis) of Digital Documenter, Handler and Analyser, except that these roles were modified to the following format:
Digital Documenter:
Handler:
To ensure that students are using inquiring skills, before starting the experiment students could work in their groups to generate a list of questions that they wish to find answers to, such as:
The experiment was modified from that of the rotten tomatoes experiment, to give students the chance to choose any fruit or vegetable, which as the introductory activity, instantly lead to a flurry of excited discussions and the selection of a wide variety of choices made, from bananas and tomatoes to cucumbers and onions (the onions were great!).
Similar to the rotten tomatoes experiment, students were grouped into threes (a mix of students of different ages was required) to complete the required roles (on a daily rotational basis) of Digital Documenter, Handler and Analyser, except that these roles were modified to the following format:
Digital Documenter:
- Takes photo(s)
- Inserts the photo(s) into the Google Sheet
- Writes down observations that are relevant, descriptive and scientific, as per the requirements outlined in the Google Sheet.
Handler:
- Is the ONLY person who handles the specimen (wearing rubber gloves)
- Measures the specimen’s temperatures and weight and orally tells the Analyser
- Puts the gloves under the container
- Draws a labelled diagrams, including cross-sectional representations, to communicate ideas.
- Returns the container and gloves outside to a secure place.
- Enters the Handler’s data into Google Sheet
- Computes the mathematical calculations accurately (e.g. Yesterday’s weight – Today’s weight = Weight Loss over night) and inputs them appropriately into the Google Sheet
- Generates a graph to represent and describe observations, patterns, trends or relationships in data
- Identifies patterns in data and develop explanations that fit these patterns.
To ensure that students are using inquiring skills, before starting the experiment students could work in their groups to generate a list of questions that they wish to find answers to, such as:
- Which fruit or vegetable will decompose the most?
- How much mould will grow?
- Will the weather temperature correlate to the external temperature of the fruit or vegetable?
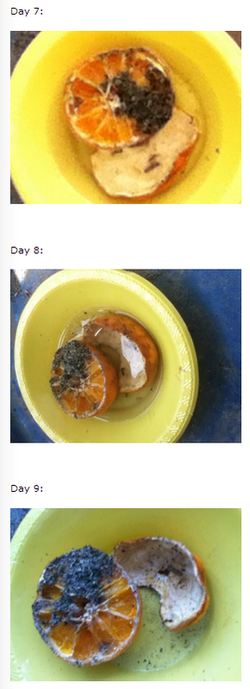
Students were required to record their information in the form of a collaborative Google Sheet (click here to access our online work) using the given prompts and to upload their photos to the class blog (see right).
Tutorials were given on how to use a variety of digital cameras and how to upload images, both via wireless and a tethered connection.
The Case of the Missing Objects
Whilst the offer was made to store the decomposing fruit and vegetables inside on a window sill, to cater for the shocking smells, the objects were placed outside under the cover of the school's library.
However, as the students soon discovered, 'possums' or 'ghosts' started stealing the fruit and vegetables of various groups. Some groups made it through the two-week experiment without the inconvenience of starting again. It also had the unexpected benefit of students rushing into school to see if their fruit or vegetable had survived, wherein groups celebrated a stay of execution or commiserated their loss.
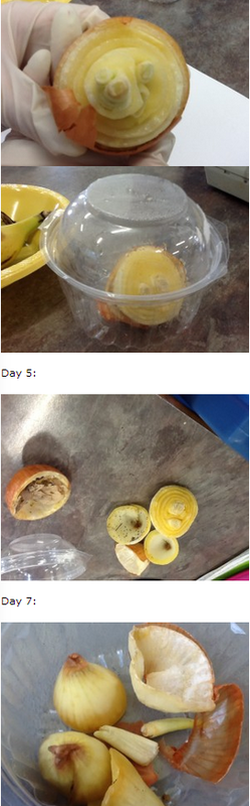
Only one group came up with the idea to shield their onion in a plastic container (which also would have impacted on the ambient temperature as the onion decomposed - see image below).
Measurement devices also mysteriously disappeared at times or batteries were found to be sapped the next day when students went to use the scales or thermometers. Read below for further details.
Tutorials were given on how to use a variety of digital cameras and how to upload images, both via wireless and a tethered connection.
The Case of the Missing Objects
Whilst the offer was made to store the decomposing fruit and vegetables inside on a window sill, to cater for the shocking smells, the objects were placed outside under the cover of the school's library.
However, as the students soon discovered, 'possums' or 'ghosts' started stealing the fruit and vegetables of various groups. Some groups made it through the two-week experiment without the inconvenience of starting again. It also had the unexpected benefit of students rushing into school to see if their fruit or vegetable had survived, wherein groups celebrated a stay of execution or commiserated their loss.
Only one group came up with the idea to shield their onion in a plastic container (which also would have impacted on the ambient temperature as the onion decomposed - see image below).
Measurement devices also mysteriously disappeared at times or batteries were found to be sapped the next day when students went to use the scales or thermometers. Read below for further details.
Measurements & Calculations
Internal temperatures were recorded using a digital meat thermometer and external temperatures using a digital infrared thermometer. The object's mass/weight was measured using digital scales (combining this with the use of analogue scales to check would have been more beneficial for their education too).
It is worth noting that considering devices mysteriously vanished at times or batteries died, that schools wanting to implement this experiment should have students sign in and out equipment or purchase multiple meat and laser thermometers and charge each unit every night.
Prior to starting the experiment, it was vital to teach the students during Mathematics how to add and subtract numbers involving decimals, so that the Analyser could perform the necessary calculations.
If analogue kitchen scales were used, it would have also been necessary to teach the class about using multiplication and division to determine the increments contained upon an analogue scale.
The Resulting Analysis
After the two week observational period had ended, students were given time to reflect back on the process and analyse the data from their Google Sheet.
The daily weather temperatures (minimum and maximum) were determined using data from a local weather tower from the Bureau of Meteorology, to look for correlations between the rise and fall of the internal and external temperatures of the fruit or vegetable (and to ensure that students could locate and interpret primary data sources from the internet).
The students were then required to collate their temperature data into an Excel spreadsheet and generate a variety of graphs. From these graphs, groups then conducted a statistical analysis to see if they could identify any trends or correlations in the data, particularly looking for any links between:
- The rise and falls in the internal and external temperatures of the fruit or vegetable and that of the (i) temperature of the weather, or (ii) the stage of the decomposition process.
- The weight/mass gains and losses and the stage of the decomposition process.
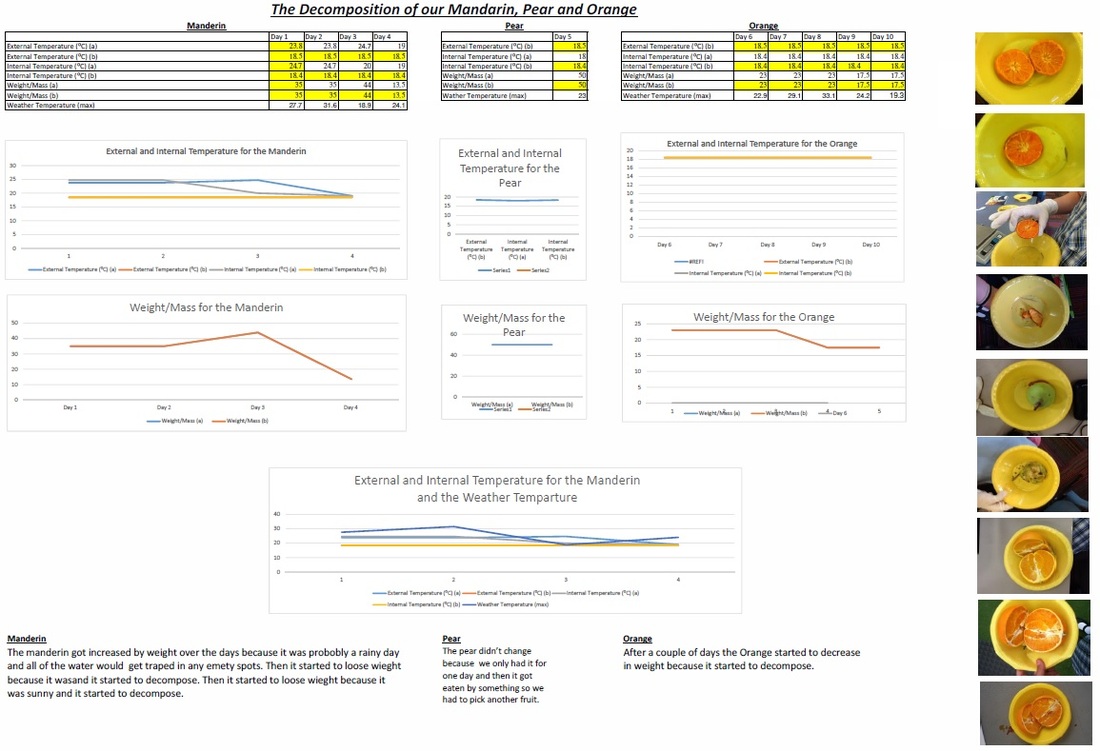
Download the student results (converted from .xls to .pdf for presentation purposes):
In Summation
The experiment was a resounding success, loved by all students, with a few hiccups along the way. It was definitely worth the time spent preparing and organising the ins and outs of the experiment. It was a valuable opportunity for the students to both collaborate simultaneously and present their work online, which could then be followed daily by their family and school staff.
Google Chrome Apps
Whilst most schools are now making the shift to use Google Apps, most don't know that about Google Chrome Apps.
Whilst Google Apps (above) work in any internet browser (e.g. Chrome, Firefox, Internet Explorer), Google Chrome Apps (below) work only in the Google Chrome browser.
By default, Google Chrome Apps already come with the Google Apps suite installed (Google Docs, Gmail, Google Search, Google Drive and YouTube).
Much like Chromebook users (who use the Chrome Web Store to download apps), Windows, Mac & Linux users can also harness the power of Chrome by downloading and purchasing apps from the Chrome Web Store for use in conjunction with the Google Chrome browser!

All one does is have to visit the Chrome Web Store (or the reviewed apps here), browse for apps and then simply look for the "+ Add to Chrome" button!
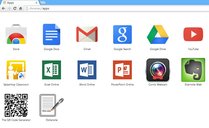
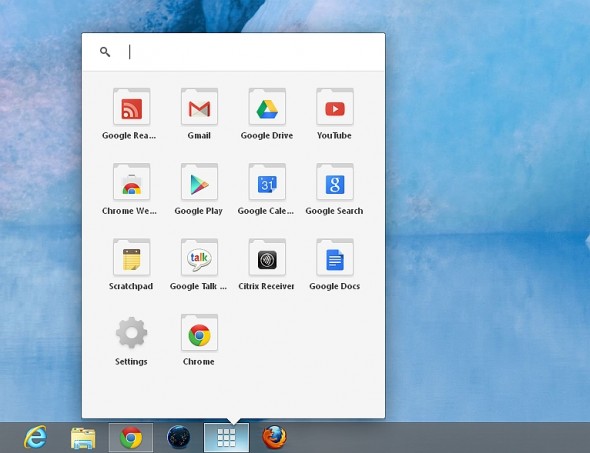
Once the apps are installed, they appear within the Google Chrome Browser (see images below).
Once the apps are installed, they appear within the Google Chrome Browser (see images below).
Chrome Apps on a Windows PC
|
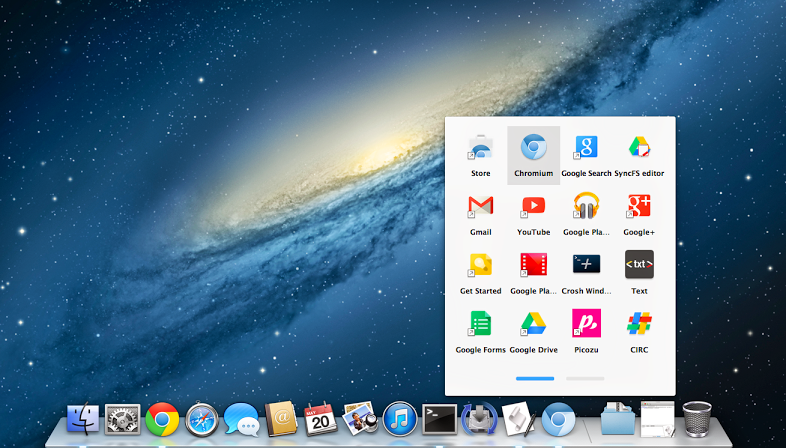
Chrome Apps on Mac
|
To then access the Chrome apps, PC/Mac/Linux users with the Google Chrome browser installed on their device can:
- Install the Chrome App Launcher to launch apps from the desktop (pictured below), or
- Type chrome://apps/ into the Google Chrome address bar (as pictured above).
Google Chrome Apps
Click here to access a page dedicated to reviewing the Google Chrome Apps.
Additional Information
To learn more about implementing Google Apps within schools, check out Google's K-12 Google Apps Implementation Guide and Learning Center.


