Image © 2014 Tangient LLC

Alternatively, you can access the Pinterest version of this page here.
With the rapid advances in technology and the prevalence of interactive whiteboards and tablet devices in schools, schools must have an eLearning plan for integrating ICT and visualisation into the teaching of Mathematics.
Use the links below to navigate to the desired location:
- Extensively Planning a Whole School or Year-Level Approach to Deliver Effective Mathematics Curriculum via Interactive Whiteboards/Projectors/Laptops/iOS & Android Devices
- Visual Literacy in Mathematics
- ST Math: Teaching Mathematics without Words
- Angry Birds Angles
- Mapping & ICT
- Data Collection & Representation: Infographics & Data Displays
- Online Mathematics Resources
- Teaching & Learning Mathematics Using Video Games
- GeoGebra
- Mathematics Apps.
Click here to access the student portal/version of this page (opens in a new window).
Extensively Planning a Whole-School or Year-Level Approach to Deliver Effective Mathematics Curriculum via Interactive Whiteboards/Projectors/Laptops/iOS & Android Devices
Developing a whole school or year-level approach to the delivery and dissemination of classes and activities via interactive whiteboards, one-to-one iPad or laptop programs or even IWB alternatives can have drastic impacts on student engagement and achievement.
Regardless of whether your school has interactive whiteboards, is looking into purchasing them, is researching alternative cost-effective methods or adopting a one-to-one iPad or laptop program, it is vital that year levels, coordinators and heads of school meet all together to extensively plan and create whole year-level technology and methodology rich Literacy and Mathematics unit using their collective expertise.
Working in London in 2012, I discovered a school that delivered a whole-school approach to integrating the use of ICT into their Writing modules (read about their Literacy approach here). Having viewed the benefits for both staff and students first-hand, I returned to Australia and spent three months full-time, researching, planning, creating and sourcing a wide-variety of units for all subject areas, particularly in the areas of Mathematics.
This effort resulted in the development of lesson resources for every content descriptor and elaboration contained within the Australian Curriculum and AusVELS Mathematics strands and sub-strands, for Foundation to the end of Year 7, ready to run on an IWB, laptop, android tablet/phone, iPad, iPod or iPhone!
These lessons and activities could be used in whole class, small group and independent work scenarios. When used independent of the teacher (by extension students or students who were absent and were catching up with the class) the lessons and activities had many parallels to the independent learner Goodger Maths program implemented primary schools in the 1980s and the Kent Maths program implemented in secondary schools in the 1990s.
Download three samples unit here:
- ACMNA122 - Types of Numbers - Odd, Even Square, Triangle, Prime & Composite - Intro To - Lessons.pptx
- ACMSP116 & ACMSP144 - Chance Experiments - Outcomes - Equally Likely Events - Describing Using Fractions, Decimals & Percentages - Lessons.pptx
- ACMSP068 & ACMSP069 - Data Investigation - Meaningful Investigations - Lessons.pptx
Having implemented this approach within a Year 4-6 composite classroom during the 2013 academic year (with students accessing work using the school's computers and a combination of school and student iPads or iPods) I found that schools and/or teachers that extensively plan a whole-school or year-level approach to deliver effective curriculum via the use of an appropriate program (e.g. PowerPoint or interactive software) and interactive whiteboards/projectors can also benefit in many different ways, including:
- A significant reduction in time spent on planning and creating lessons during the each week
- A more clear and cohesive approach to delivering effective curriculum
- The portability of lessons across any device, including computers, laptops, android tablets/phones, iPads, iPods or iPhones
- Placing lessons/units on a cloud-based homework server (e.g. Google Drive, MyClasses, Schoology, a class blog, or an Online Learning Management System, etc.) so that individual students could access the lessons at home to revise their daily learning after they had come home from school or keep up if they were absent from school due to sickness but still wanted to do school work from home
- Placing lessons or units on a student accessible drive on a school network, so that students could access them via classroom computers or tablet devices (using lesson dissemination apps: FileExplorer (iOS), Idea Flight (iOS), Smoothboard Air (iOS & Android) or ESFileExplorer (Android)) and work through the lessons at their own pace to cater for:
- Students who were absent and might other-wise "miss" the lesson or require one-to-one time with a teacher or peers, to catch up
- Integration children (with or without an aide)
- Fast finishers or advanced students, who could extend their learning by accessing the next lesson(s) or activities, and at the same time act as the test students (or "experimental bunnies") to allow teachers to preview any pitfalls or successes before teaching the next step to the whole class
Once schools or year levels have developed their unit resources for Mathematics and combine them with approaches to effectively integrate ICT into the other subject areas, it becomes a simple task to create additional lesson resources for the other curriculum areas.
Visual Literacy in Mathematics
As discussed in the Ted Talk below (see ST Maths), words can be a major hurdle for students to achieve success in Mathematics. Therefore it is important that teachers attempt to teach Mathematics using the most visual and practical approaches possible.
One of these approaches is to employ the philosophy of Visual Literacy, to use highly effective images to enable students to more readily interpret and make meaning from presented mathematical material.
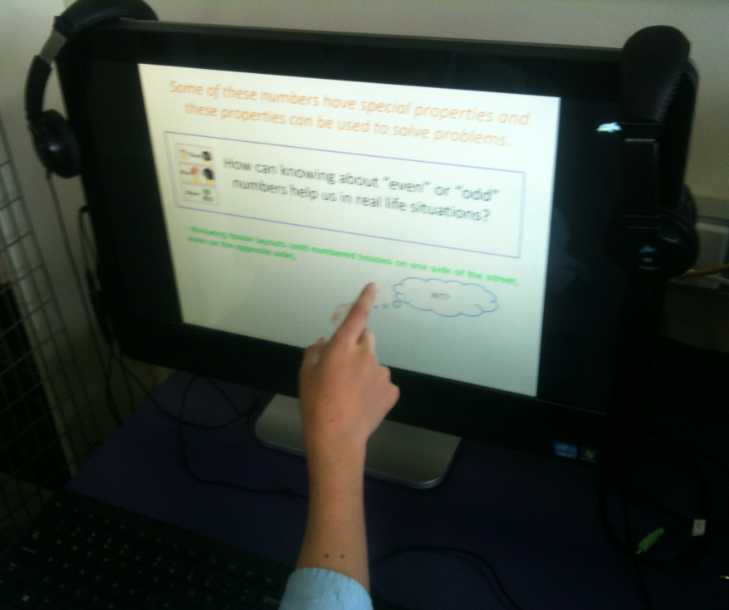
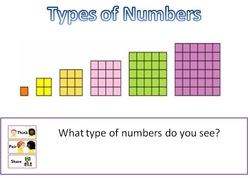
Pictured right is a slide from the following downloadable lesson that is designed around the use of visual literacy to teach students about:
Another presentation that uses visual literacy to explain index notation/exponents can be downloaded here.
Teachers should attempt to employ a visual literacy approach and the rest of the ideas contained within this webpage to create ICT enriched visual ideas to help students learn mathematics.
Pictured right is a slide from the following downloadable lesson that is designed around the use of visual literacy to teach students about:
- The different ways that numbers can be categorised.
- How to identify and complete number patterns and sequences such as square, cubed, triangular, prime and composite numbers.
Another presentation that uses visual literacy to explain index notation/exponents can be downloaded here.
Teachers should attempt to employ a visual literacy approach and the rest of the ideas contained within this webpage to create ICT enriched visual ideas to help students learn mathematics.
ST Maths (USA & Canadian Schools Only)
ST Maths is a brilliant insight as to the role that visual imagery plays in teaching and learning mathematics. Watch the following TED Talk introducing why ST Maths was created.
As discussed in the Ted Talk above, words can be a major hurdle for students to achieve success in Mathematics. Therefore the MIND Research Institute created a visual approach to learning and teaching mathematics in the form of its ST Math software.
Image © MIND Research Institute
ST Math teaches mathematics through visual math games that are interactive and give visual feedback.
As ST Math removes words, it is also highly valuable when teaching mathematics to ESL/EAL students as well as pre- and emergent readers.
As ST Math removes words, it is also highly valuable when teaching mathematics to ESL/EAL students as well as pre- and emergent readers.
It is also an ideal mathematical game for young children to play as not only is it based on years of research surrounding the human mind, players must solve mathematical problems to navigate JiJi the penguin through a series of problems and puzzles.
Watch the videos below to learn more about ST Math:
Watch the videos below to learn more about ST Math:
Play a sample ST Maths Flash game here. Browse the MIND Research website and then request more information from MIND Research here.
Angry Birds Angles
Teaching students about angles and how to correctly use protractors is so easy when using the following ICT tools and one of the worlds most popular games, Angry Birds! Read the step-by-step guides below to install Angry Birds and the relevant interactive projectors below.

Introductory Activities
Students should use the following ICT tools to explore the concept of angles and how to use a protractor before embarking on the angry birds approach detailed below.
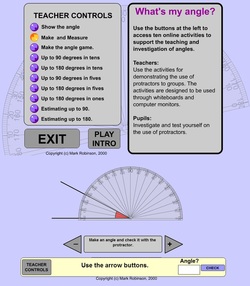
'What's my angle?' by Mark Robinson is a brilliant flash object that introduces angles, protractors and how to measure angles of various sizes.
Regardless of whether the tool is used in a whole class, small group or individual setting, students simply need to be taught the two rules:
Regardless of whether the tool is used in a whole class, small group or individual setting, students simply need to be taught the two rules:
- One of the two "0" lines on the protractor must be placed on one of the rays originating from the vertex
- The protractor's mid point must be placed at angle's vertex.
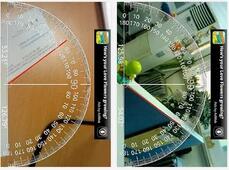
Ever needed students to measure an angle within the classroom or school that they couldn't reach or where a protractor wouldn't fit?
Augmented Reality Protractor is a free app that enables students to measure angles using an augmented protractor via an Android device.
Augmented Reality Protractor is a free app that enables students to measure angles using an augmented protractor via an Android device.
Angry Birds Angles

Given its popularity with young children and adults, Angry Birds should be used in the middle and senior years classrooms to teach students about angles.
Generally speaking,
Angry birds is available on a variety of platforms. Read below for which platform(s) is best suited for the particular classroom learning setting.
Generally speaking,
- in the middle years, students need to classify angles to be more than or less than another angle
- in the senior years, students need to be able to estimate angles within 10 degrees and mark and measure angles with 2 degrees.
Angry birds is available on a variety of platforms. Read below for which platform(s) is best suited for the particular classroom learning setting.
Whole Class Learning Scenario
For the following whole class lesson, teachers will need:
For the following whole class lesson, teachers will need:
- An interactive protractor for use on an IWB.
- TeamBoard Draw installed on a Windows/Mac/Linux PC (which contains the interactive protractor).
- Angry Birds (free or paid versions):
- Windows/Mac/Linux: Angry Birds for Chrome browser or
- Windows/Mac via BlueStacks (a free version of Android for Windows or Mac PC's. Once you have installed BlueStacks, link your Google Account to BlueStacks, download any Angry Birds from Google Play and then run BlueStacks in Windowed Mode by clicking the box next to the exit/cross)
- iOS and (i) a PC with Reflector/AirServer running in Windowed Mode or (ii) Apple TV connected to an IWB or TV running in Windowed Mode.

NOTE: Depending on the version of Angry Birds installed on the device, the bird's trajectory:
- May be shown as the user pulls back on the bird in the slingshot (as pictured right in Angry Birds Space), or
- Only after the first bird has been launched, then the previous shot's trajectory will be shown.
Teachers should:
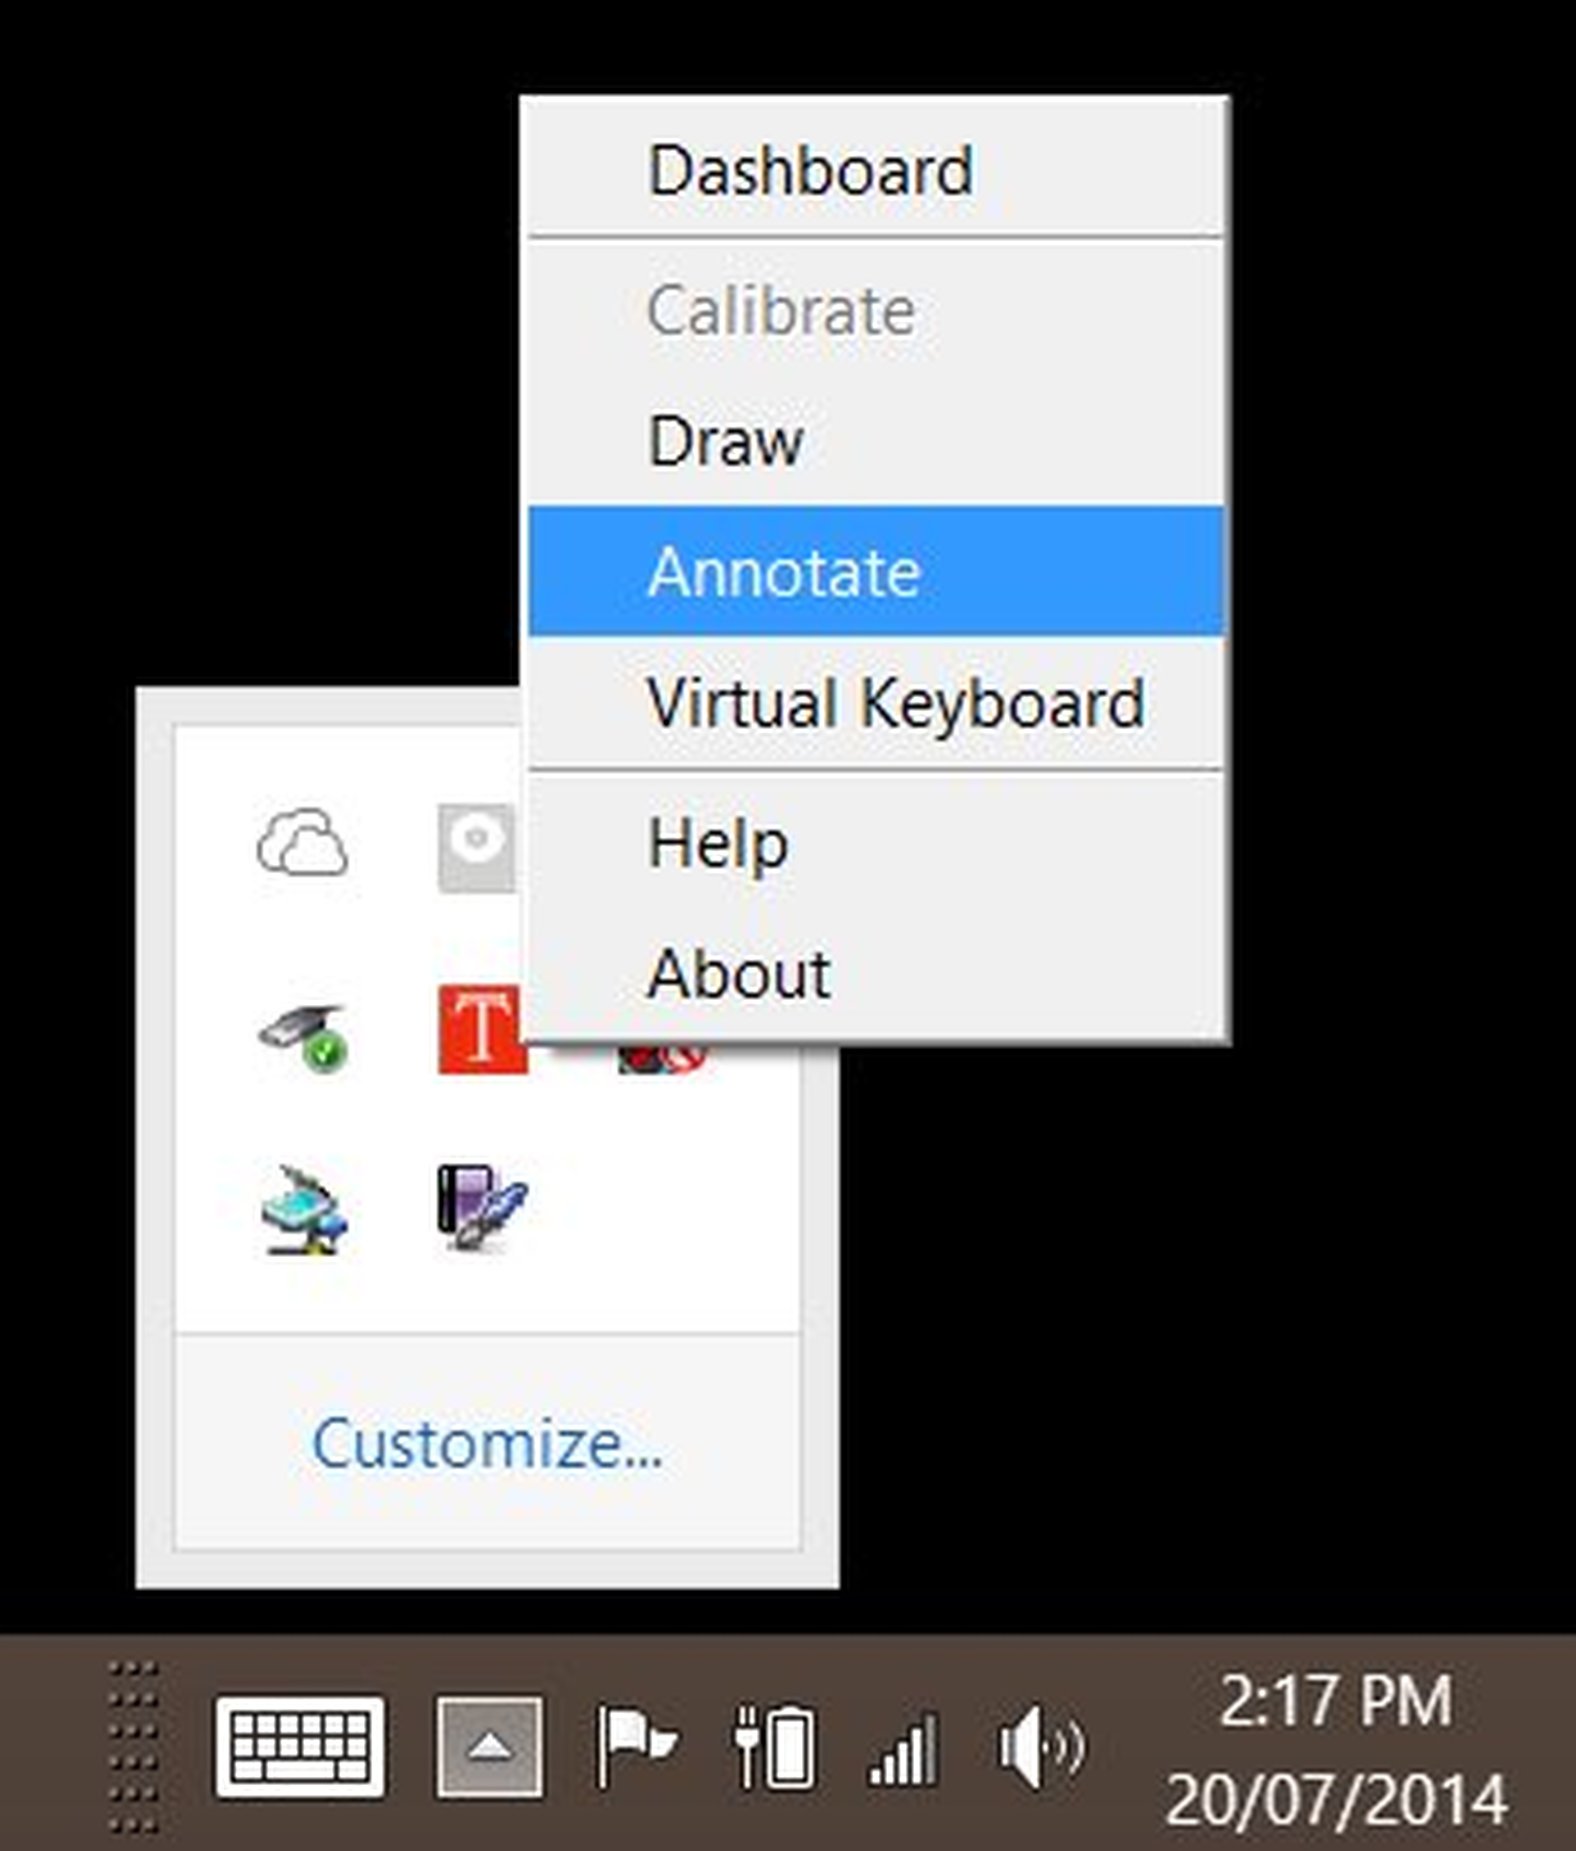
At this point the teacher must activate an interactive protractor (such as the one contained within TeamBoard Draw's Annotate function). This can be done by the following steps:
- Open Angry Birds (making sure that it is running in Windowed Mode so that you can access the task bar/clock area).
- Choose a level.
- Get a student to aim a kamikaze bird by holding their finger/mouse on the bird in the catapult, and then dragging their finger/holding the mouse click and moving the mouse backwards to build up power.
- Ask the student to let the kamikaze bird go to see if their aim was successful (if all of the pigs are not defeated/eliminated, users will be given another shot but this time the trajectory of the unsuccessful attempt will be shown on the screen).
- Ask the student to return to their table/floor.
At this point the teacher must activate an interactive protractor (such as the one contained within TeamBoard Draw's Annotate function). This can be done by the following steps:
|

|
As pictured below, the full TeamBoard Draw/Annotate toolbar will appear and can be moved anywhere on the screen as a floating toolbar.
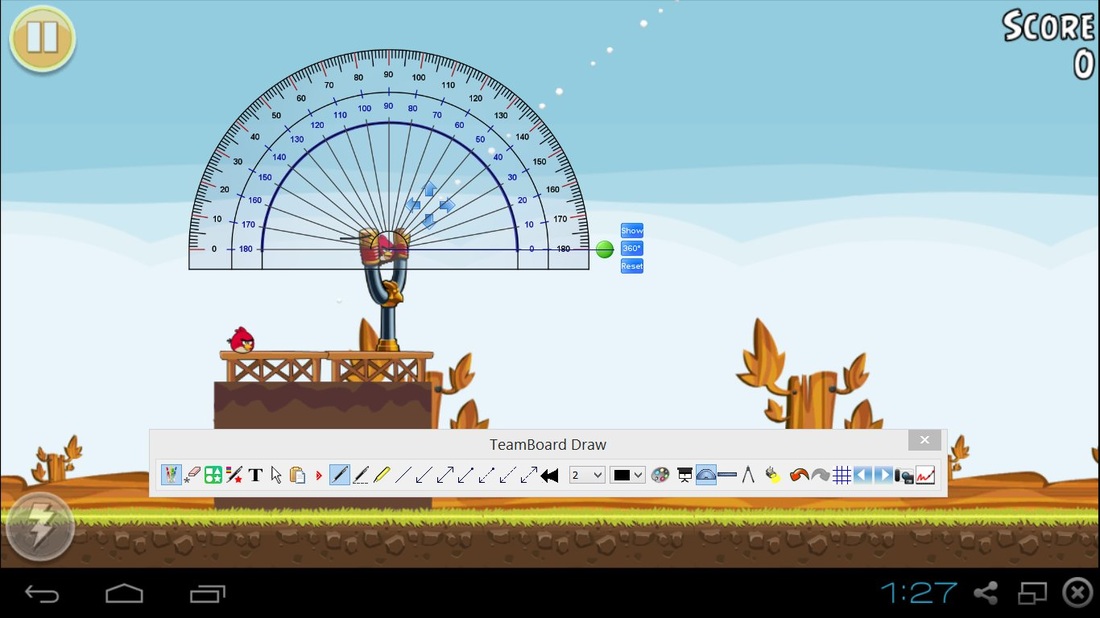
- As pictured above, place the centre point of the large protractor (interactive or handheld) onto first dot of the trajectory, keeping the "0" line horizontally in line with the top of the slingshot to measure the size of the angle.
- Ask the class to discuss in pairs if the think the angle of the trajectory needs to be increased or decreased.
- Determine how many degrees they believe that the angle should be increased or decreased.
- Close the TeamBoard Draw window (and any other TeamBoard windows that pop up).
- Choose a student to launch the next kamikaze bird using the student's or class' thinking.
- Repeat all of the above steps until the pig(s) is/are defeated or the user has no more kamikaze birds remaining.
Small Group/Individual Learning Scenario
Angry Birds can be used on any platform for use by students in both small group and individual settings.
Students simply need:
AND ONE OF THE FOLLOWING:
Angry Birds can be used on any platform for use by students in both small group and individual settings.
Students simply need:
- A protractor
- Access to a PC containing an interactive protractor (e.g TeamBoard Draw)
AND ONE OF THE FOLLOWING:
- A PC/Laptop with either Windows, Mac or Linux via Angry Birds Online.

NOTE: Depending on the version of Angry Birds installed on the device, the bird's trajectory:
Students should:
- May be shown as the user pulls back on the bird in the slingshot (as pictured right in Angry Birds Space), or
- Only after the first bird has been launched, then the previous shot's trajectory will be shown.
Students should:
- Open Angry Birds.
- Choose a level.
- Aim a kamikaze bird by holding their finger/mouse on the bird in the catapult, and then dragging their finger/holding the mouse click and moving the mouse backwards to build up power.
- Let the kamikaze bird go to see if their aim was successful (if all of the pigs are not defeated/eliminated, users will be given another shot but this time the trajectory of the unsuccessful attempt will be shown on the screen).
- Place the center point of the hand-held or interactive protractor onto first dot of the trajectory, keeping the "0" line horizontally in line with the top of the slingshot to measure the size of the angle.
- Determine if they need to increase or decrease the size of the angle.
- Determine how many degrees they believe that the angle should be increased or decreased by.
- Launch the next kamikaze bird.
- Repeat steps 3 to 8 until the pigs are defeated or the user has no more kamikaze birds remaining.
Mapping & ICT
Teachers should be integrating a variety of modern technologies when teaching mapping/location units. Here are just a few:
Google Maps
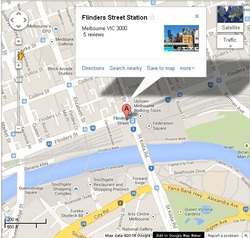
Students should be using Google Maps on a variety of platforms (ie. Windows/Mac/iPod/iPhone/Android) to:
(i) Locate landmarks in their local community, state and Australian, using:
Alternative online maps such as Apple Maps (use the 'Flyover' feature), Street Directory and Whereis should also be used to compare a variety of approaches to locate the same landmark.
(i) Locate landmarks in their local community, state and Australian, using:
- Normal view (pictured)
- Street view (drag the yellow man onto the map)
- Satellite view
- Traffic view
Alternative online maps such as Apple Maps (use the 'Flyover' feature), Street Directory and Whereis should also be used to compare a variety of approaches to locate the same landmark.
Google Earth

Students should be using Google Earth to explore the mathematical concepts of location, positional language, scale and distance in both Google Earth and Street View modes.
Use the Google Earth web browser plugin or download Google Earth for:
Use the Google Earth web browser plugin or download Google Earth for:
As shown in the images below, Google Earth can be used in measurement scenarios.
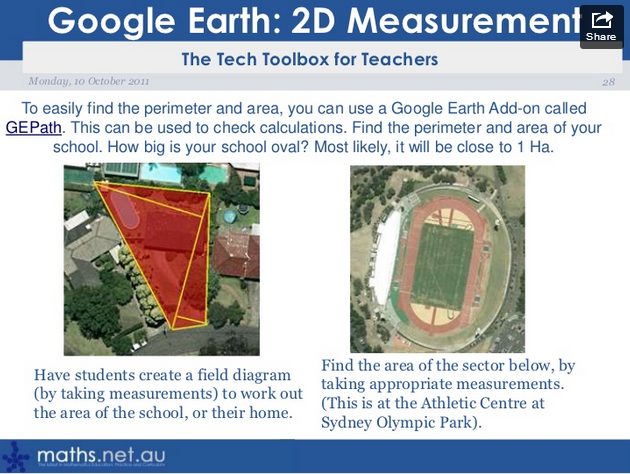
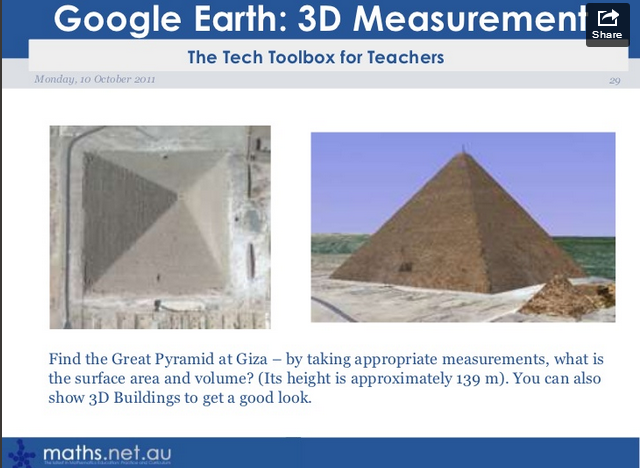
Images: © Joshua Harnwell
Google Earth & Kinoogle
Schools should explore the ability to combine the use of Google Earth with Kinoogle, a gesture and body movement interface that harnesses the power of Microsoft's Kinect to have students using highly engaging virtual reality tools to learn Mathematics.
Watch the video below to see Kinoogle in action and then click here to learn more about Kinoogle (opens in a new window).
Watch the video below to see Kinoogle in action and then click here to learn more about Kinoogle (opens in a new window).
Data Collection and Representation
Educators and students should be using a variety of ICT tools to collect and represent data. Learn more about how to use and create infographics and other data displays below.
Infographics
What Are Infographics?

Infographics are visual representations of information or data that presents data (simple and complex) in an easy to understand visual form.
Data representation in schools normally consists of students creating, by hand or with the assistance of technology, picture (simple & where one picture can represent many values), bar, column and side-by side graphs as well as dot, stem and leaf plots. Whilst infographics have been around for decades, the use and creation of infographics in the senior year levels of schools is now an emerging trend, as the technology to allow students to create infographics has become more readily available and easy to use.
Data representation in schools normally consists of students creating, by hand or with the assistance of technology, picture (simple & where one picture can represent many values), bar, column and side-by side graphs as well as dot, stem and leaf plots. Whilst infographics have been around for decades, the use and creation of infographics in the senior year levels of schools is now an emerging trend, as the technology to allow students to create infographics has become more readily available and easy to use.
Why Use Infographics?
Check out the following 13 reasons why we use infographics: Animated & Interactive Version.
The focus of any Mathematics curricula is to have students collect & represent data and to recognise, interpret & create various data displays. If schools are truly to prepare students to interpret and understand data in real world scenarios, infographics are naturally the next step in the teaching of the interpretation and creation of data displays.
The focus of any Mathematics curricula is to have students collect & represent data and to recognise, interpret & create various data displays. If schools are truly to prepare students to interpret and understand data in real world scenarios, infographics are naturally the next step in the teaching of the interpretation and creation of data displays.

Note: Currently in the Australian Curriculum, students are required to create a range of data displays, including picture, column & bar graphs and dot, stem and leaf plots. However, even though infographics are now in the mainstream, they are not specifically mentioned in the Australian curriculum, but there are two references to visualisation:
- In the Year 5 and 6 band, students must ',...use a range of commonly available software to interpret and visualise data in context to create information (ACTDIP016), with the elaboration stating 'Using data visualisation software to help in interpreting trends, for example uploading data to a web application and building a visualisation of the dataset'
- In the Year 7 and 8 band, students must 'Analyse and visualise data using a range of software to create information, and use structured data to model objects or events (ACTDIP026)'.
Teaching Students To Understand and Create Infographics
Step 1: Use the images and video below to introduce the concept of infographics:

Look at how effectively football statistics can be presented by using infographics instead of tables of data or simple graphs.
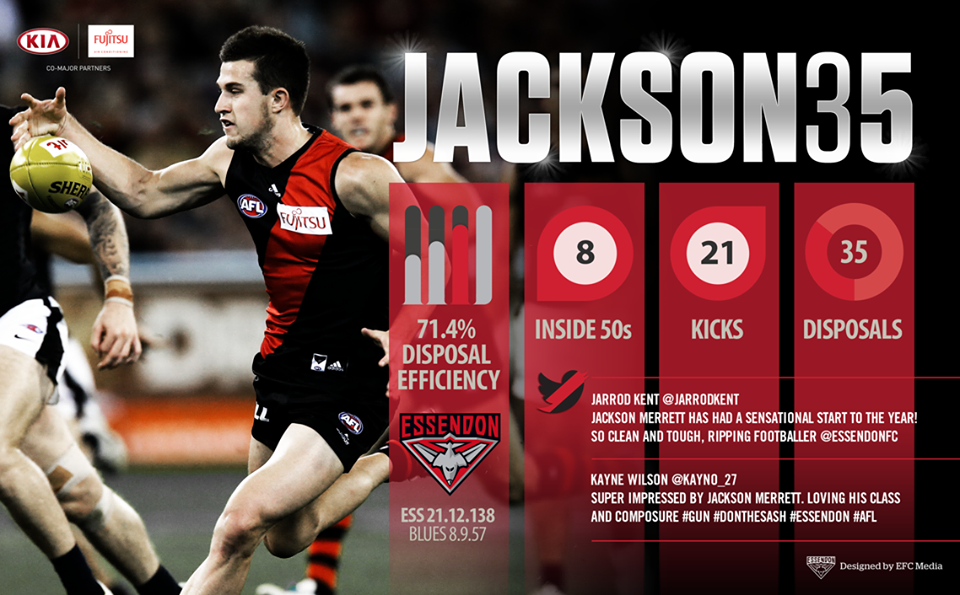
Image © Essendon Football Club
The Value of Visualization from Column Five on Vimeo.
Step 2: View a collection of infographics (search for 'infographics' on Google Images or download Infographics Hub on iOS devices) and discuss the features (i.e. layout, heading, suitability of graphics and colour schemes) of each of the infographics and identify the positive and negative features.
Step 3: View and discuss the data that students have collected or could collect, and then brainstorm how infographics could be used to best present the data (to tell a story, make comparisons, show context, processes, patterns, a hierarchy, relationships, order or chronology), including the use of:
Step 4: Plan/Sketch rough outlines/drafts of infographics (in pairs or individually) on paper and
reach students to use ICT to present their infographics by any of the following solutions:
- appropriate graphics/shapes
- colour
- sizing
- font and font styles
- orientation/Rotation
- spacing
- flicker.
Step 4: Plan/Sketch rough outlines/drafts of infographics (in pairs or individually) on paper and
reach students to use ICT to present their infographics by any of the following solutions:
- Easel.ly (All Platforms) - Free - Watch the video here
- StatPlanet (All Platforms) Free
- Microsoft PowerPoint (Win/Mac/iPad)
- Hohli Online Chart Builder (All Platforms) Free
- Open Office Impress (Win/Mac/Linux) - Free
- LibreOffice (Win/Mac/Linux) - Free
- Pages (Mac: $20.99 & iPad: $10:49)
- Any high-end graphics program - Free & Paid.
Data Displays
Whilst schools normally limit themselves to teaching students how to use Microsoft Excel to input, sort and display data (using the chart tools), schools should be using both Mircosoft and third-party data display plugins for Microsoft Office.
Flevy Tools Plugin for PowerPoint
One such third-party solution is Flevy Tools, a free (for a limited time) PowerPoint plugin (pictured above) that provides a set of automated diagramming tools for generating waterfall charts, approach diagrams, step box diagrams, Harvey Ball diagrams, Gantt charts, circular approach diagrams, pyramid diagrams, relationship diagrams, segment diagrams, and rating diagrams.
To download the Flevy plugin for PowerPoint:
To download the Flevy plugin for PowerPoint:
- Visit the Flevy Tools website.
- Enter your email address and share their link via social media.
- Check your email.
- Download the zip file sent to you by Flevy.
- Navigate to your unzipped files from step 4.
- Either double-click on the relevant file (e.g. flevy_tools__2007+.ppam) each time that you would like to use the tools or follow the steps from READ ME FIRST.txt to permanently install the Flevy plugin.
Online Mathematics Resources
There are a myriad of online Mathematics lessons and activities that are designed for whole-class, small group and individual scenarios. Here are some of the excellent resources:
Scholastic Study Jams: Mathematics
Image © Scholastic Education
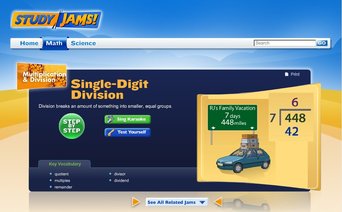
Scholastic Study Jams provides free online interactive mathematics modules to help students learn and explore mathematics. Each Mathematics Study Jam is based around a wonderfully designed animated video involving students encountering and discussing mathematics in real life situations. After working through the applicable module in an interactive and animated step-by-step mode, students can undertake various activities and tests and attempt to discuss key terminology to show their developing understanding.
The Mathematics Study Jam are perfect for whole class, small group and individual learning scenarios. Check out the Mathematics Study Jam today!
The Mathematics Study Jam are perfect for whole class, small group and individual learning scenarios. Check out the Mathematics Study Jam today!
Education Alberta's 'Math 6 Spy Guys'
Image © Alberta Education
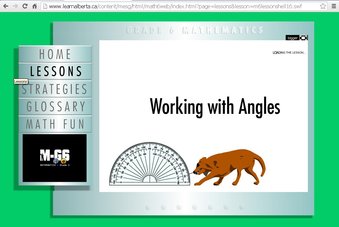
Alberta Education (Canada) provide wonderful self-paced online tutorials to help students learn and explore mathematics.
Each lesson is based around animated 'Spy Guys' (e.g. FBI styled characters) who give students the "low down" on various areas of seniors years mathematics (it is stated Year 6 but is suitable for students in Years 5-7).
Strategies for solving mathematical problems, an interactive glossary and a rotational set of interesting mathematical facts are also available.
The lessons are perfect for whole class, small group and individual learning scenarios. Check out the Math 6 Spy Guys today!
Education Alberta's 'Math Live'
Image © Alberta Education
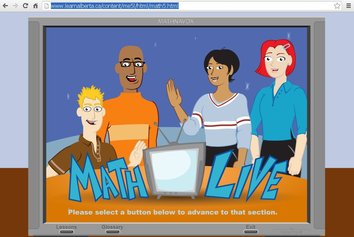
Alberta Education (Canada) provide another wonderful self-paced online tutorials to help students learn and explore mathematics.
In Math Live, cartoon characters teach various areas of seniors years mathematics (it is stated Year 5 but is suitable for students in Years 4-7). An activity sheet (pdf) is available for download for each lesson too as well as an online glossary.
The lessons are perfect for whole class, small group and individual learning scenarios. Check out Math Live today!
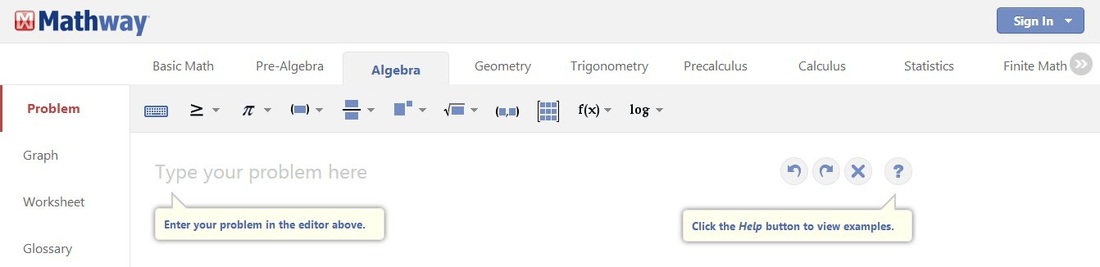
Mathway: Online Problem Solver
Mathway is a multi-faceted online problem solver. Users can enter just about any mathematical equation and Mathway will attempt to use it's complex system to solve the problem.
Mathway may even be a suitable replacement for a graphing calculator as users can also graph problems using the 'Graph' tool.
Mathway may even be a suitable replacement for a graphing calculator as users can also graph problems using the 'Graph' tool.
Wolfram Alpha (Like 'Google' for Mathematics)
WolframAlpha is an internet-based free service that gathers and processes mathematical data and performs computations for the general public, essentially acting as Google for mathematicians. Users simply type in a mathematical equation or question into the search box (pictured below) and WolframAlpha will scan its databases for the solution for your query.
WolframAlpha also provides various examples of its services for students and teachers to browse. Simply click "Examples" which is located the search bar (pictured above) to discover the various uses of WolframAlpha.
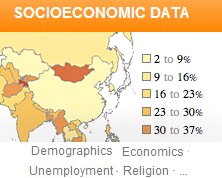
One of their services provides graphical representations of socioeconomic data which is useful for showing senior years students a variety of data displays that can be used to present analysed data.
One of their services provides graphical representations of socioeconomic data which is useful for showing senior years students a variety of data displays that can be used to present analysed data.
Manga High Math Games
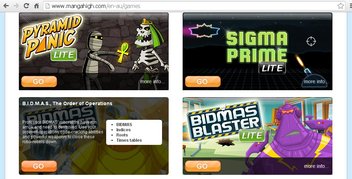
MangaHigh.com provides fun interactive mathematical games with highly detailed manga graphics.
Short versions of the free games are instantly available and full versions are also available for free when schools register and create an account.
Short versions of the free games are instantly available and full versions are also available for free when schools register and create an account.
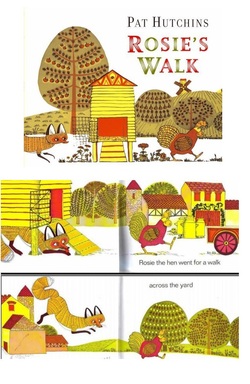
Rosie's Walk: eBooks
Pat Hutchins' story Rosie's Walk is another great resource for teaching positional language to young students whilst also embracing the use of readily available technology.
Simply:
- Use an interactive whiteboard to watch Scholastic's online animated and narrated version here. Pause the video each time that the students hear or see positional language used or depicted and discuss.
- Once the class had viewed the whole book, then use a digital camera to take photos of various students re-enacting the story whilst positioning the photographs to depict the students demonstrating the actions and positional language of both characters.
- Then either as a class or in pairs, the students can rewrite the book using PowerPoint, SmartNotebook or any other ebook creating programs, highlighting the positional language and using the student photos in replace of the original illustrations.
Teaching & Learning Mathematics Using Video Games
There are a wide variety of video games for PC, Mac, Nintendo, Playstation and X-Box that can be used both at home and in the classroom to engage students in learning mathematical concepts. Check out the various ideas below for your desired platform.
Timez Attack!

The original Timez Attack by Big Brainz was released in the early 2000s as the ultimate video game for Windows and Mac designed for students to learn or consolidate their knowledge of multiplication, division, addition and subtraction.
Check out the video below and download the original version here.
Check out the video below and download the original version here.
TimezAttack has now been integrated into Imagine Maths Facts by Imagine Learning. Check out the video below and be blown away!
Numberlys

Price: $7.49
Description: Numberlys (iOS) is a part motion picture, part video game app for iPhone and iPad, created by the team behind the highly popular 'The Fantastic Flying Book Of Mr Morris Lessmore'.
The story/concept behind the design of Numberlys is that there once existed a world that was colourless and only contained numbers. The five protagonists (the numbers 1, 2, 3, 4 and 5) set out on a voyage of discovery to change the boring norm and create letters/the alphabet.
During the gameplay it is hoped that young children start to develop a sense of the shape and 'origins' of the letters of the alphabet.
Watch the video review below that explains and demonstrates exactly how the app works.
Pacman & Ms Pacman
Pacman & Ms Pacman, the most classic of video games, can be easily used in the junior years classroom to teach students positional language (up, down, left, right, forwards or backwards).
Used in either a whole class, small group or a paired setting, setting, a teacher or a student can control Pacman/Ms Pacman with their eyes closed whilst following the oral instructions of the whole class, a nominated student or a partner (when working in pairs).
Pacman & Ms Pacman can be easily played for free (all 256 levels) on all platforms using the following links:
Pacman & Ms Pacman can be easily played for free (all 256 levels) on all platforms using the following links:
Mathematics on the Nintendo & X-Box
Click on the links below to navigate to the 'Teaching & Learning Through Video Games' sections:
GeoGebra
GeoGebra is a free (for non-commercial users) open source interactive geometry, algebra, statistics, and calculus software for a range of platforms.
Whilst parts of Geogebra can be used online, a GeoGebra download for each interactive tool is available for all platforms here.
Mathematics Apps
Whilst there are a plethora of Mathematics apps for iOS and Android devices, here are just a few handy ones:
My Script Calculator 2 - Handwriting Calculator

Price: Free
Description: Unlike normal calculator apps, this calculator allows users to write the equation using their finger!
Watch the video below to see the app in action:
Description: Unlike normal calculator apps, this calculator allows users to write the equation using their finger!
Watch the video below to see the app in action:
Spyglass: Augmented Reality Compass
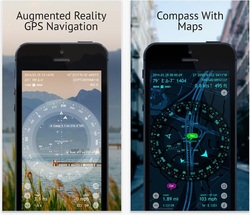
We've all seen students navigating themselves around a school or local area whilst learning about the points of a compass.
Spyglass takes this experience one step further by superimposing a compass, GPS data, distance measurements and angles over the local environment.
Spyglass is available for iOS devices.
Spyglass takes this experience one step further by superimposing a compass, GPS data, distance measurements and angles over the local environment.
Spyglass is available for iOS devices.


